As Bob Dylan said, “you don’t need a weatherman to know which way the wind blows.” Likewise, you probably don’t need to consult a website to know if the air is polluted by smoke from the various Northern California fires. But it does

help to know just how polluted it is and whether it’s unhealthy to go outside or leave your windows open.
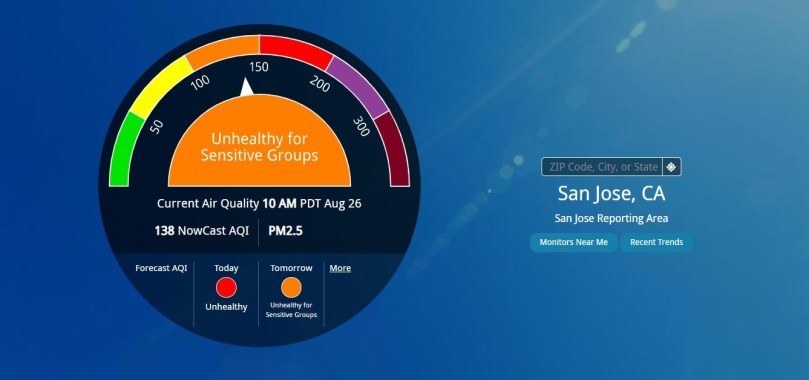
The Environmental Protection Agency operates AirNow.gov which displays the Air Quality Index (AQI) in your general locality. For example, as I write this column, the AQI for Palo Alto is reported as 150, which is considered unhealthy. But there’s a catch. That data isn’t coming from sensors in Palo Alto but one in Redwood City, which is about 10 miles away. In meteorological terms, 10 miles isn’t far, but when it comes to air quality, even a few blocks can make a difference. As I describe later, a privately-owned neighborhood sensor reports that the air quality at my house is quite a bit better at the moment.
Sensors measure data in various scales that typically result in an Air Quality Index or AQI. The EPA and most other reporting agencies use a color scale to report summary results. Green is good (0 to 50) AQI, yellow is moderate (51 to 100), orange is unhealthy for sensitive groups (101 to 150), red is Unhealthy (151 to 200), purple is very unhealthy (201 to 300) and maroon is hazardous (301 to 500). “AQI values below 100 are generally thought to be satisfactory,” according to a website operated by the U.S. Forest Service.
The sensors maintained by the EPA or state and local governments are sophisticated and very expensive, and they are used for regulatory purposes as required by federal law. They measure particulate matter (also called “PM” or particle pollution), which is a mixture of solid particles and liquid droplets found in the air. As the EPA points out, “Some particles, such as dust, dirt, soot, or smoke, are large or dark enough to be seen with the naked eye. Others are so small they can only be detected using an electron microscope.” They also measure ground-level ozone and other pollutants. All of this is collected and archived by the EPA and can be found on various webpages, including epa.gov/outdoor-air-quality-data, which offers numerous reports broken down by locality.
Data for your general area
The main site for finding air quality is AirNow.EPA.gov, which provides data from sensors located around the country. As I said, this is sophisticated and expensive equipment, and there is a limited number of them. Still, the data can be useful, especially for research purposes. There is even a link on the AirNow.gov page that lets you compare air quality in different parts of the country.
While AirNow.gov gives a good overview of your general area, it does not zoom in on your neighborhood unless you happen to live near one of the sensors. Fortunately, there are other sensors out there that the EPA and other sites report on, which can give you a more precise reading on a neighborhood basis.
Neighborhood level data
Unlike the official EPA sensors, the ones scattered widely throughout the area are relatively inexpensive (less than $300) and crowd-sourced, in that they are likely owned by homeowners and local businesses. One popular source for these sensors is Purple Air, a private company that not only sells the sensors but networks them via WiFi to report their findings to anyone who cares to check. You can access data from nearby sensors at PurpleAir.com, which allows you to zoom in on your own neighborhood. It took me a while to zoom directly to my house but — once I did — I discovered that there is a sensor two doors away, which gives me precise data on what I will experience from my house. In addition to proximity, these sensors are also more up-to-date. By default, it gives you a 10-minute average. It uses the same color codes as the EPA site and reports the AQI as a number. For example, when I check on Wednesday morning, the AQI nearest my house was 61, while AirNow.gov was reporting 48 based on a reading from 90 minutes earlier and 10 miles away.

Purple Air sells monitors for either indoor or outdoor use. They require access to a power plug and WiFi. The three models include an indoor sensor ($179), an outdoor or indoor sensor ($229) and an outdoor/indoor sensor with 16 GB of internal storage for $259.
EPA pilot project has hyper-local data

The EPA is aware of the limitations of its official regularly sensors so they also offer crowdsourced data at Fire.AirNow.gov. As the site points out, it’s a “pilot project to add data from low-cost sensors to the Fire and Smoke map. Although these sensors don’t meet the rigorous standards required for regulatory monitors, they can help you get a picture of air quality nearest you especially when wildfire smoke is in your area.”
Like the reporting sites, Fire.AirNow.gov presents data on a map with the same color codes. If you locate a sensor near you, you can click on it to see what type of sensor it is (they access Purple Air and several other brands), the exact AQI and the time it was last updated. It also shows the air quality over a period of previous times and data.
Larry Magid is a tech journalist and internet safety activist.


