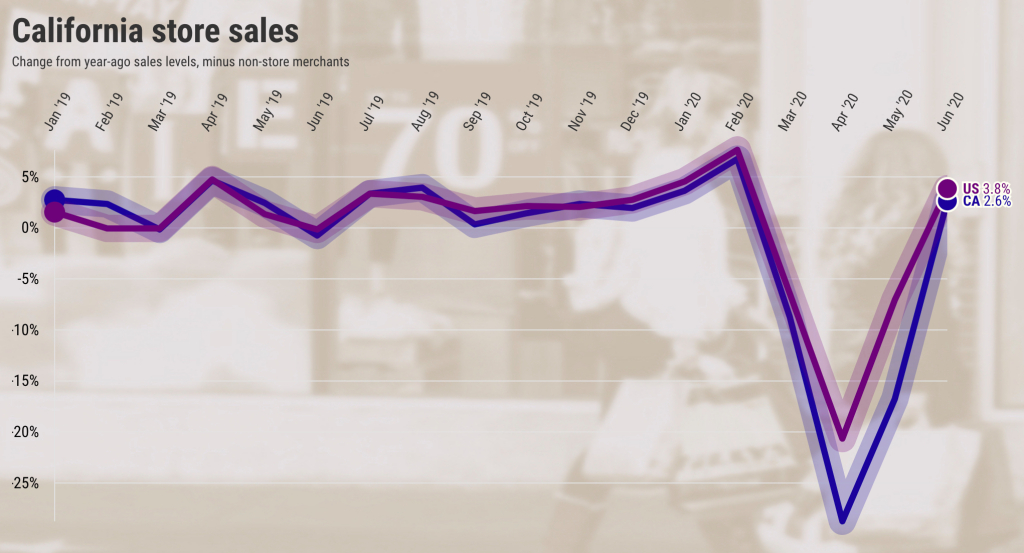
A new measure of state retail spending shows California merchants suffered from a below-average rebound in June following a deep pandemic-related plunge in shopping.
The U.S. Census Bureau has released its first “experimental” monthly measure of retail spending, an attempt to estimate shopping habits at a local level. It’s good timing as we thirst for insight into how the pandemic and efforts to slow its spread have impacted the economy.
By this math, California stores took in 2.6% more sales in June vs. the year-ago period. Merchants selling building supplies, food and sporting goods fared best. Electronics and appliance sellers and gas stations fared the worst. (Note that these stats do not include online spending at “non-store merchants”; dates to the start of 2019; and just tracks year-over-year changes in spending.)
Nationwide sales growth fared better: Up 3.8% in June. Merchants in only 12 states did worse than California. Best was Montana, up 10% in the year. Worst? District of Columbia, off 7.5%.
June was a sharp improvement to the previous three months when California’s economy operated under some of the nation’s strictest “stay at home” mandates. Store sales ran an average 18% below year-ago levels in March through May vs. a nationwide drop of 11.4% in the same period.
Here is how California’s June sales in key retail categories compared with June 2019 and the comparable national change, ranked by sales growth:
Building supplies: 25% vs. 25% nationally.
Food/beverages: 15% vs. 11% nationally.
Sports/music/books: 15% vs. 23% nationally.
Vehicles/parts: 9% vs. 10% nationally.
Other retail: 6% vs. 1% nationally.
Health/personal care: Down 2% vs. 3% nationally.
Furniture/home furnishings: Down 6% vs. 2% nationally.
General merchandise: Down 9% vs. 2% nationally.
Clothing/accessories: Down 16% vs. -25% nationally.
Gas stations: Down 24% vs. Down 19% nationally.
Electronics/appliances: Down 33% vs. Down 19% nationally.


