”Survey says” looks at various rankings and scorecards judging geographic locations while noting these grades are best seen as a mix of artful interpretation and data.
Buzz: Real estate’s secret sauce remains “jobs, jobs, jobs,” but California and other states continue to struggle to keep their homebuilding apace with a growing workforce.
Source: My trusty spreadsheet looked at an often-overlooked factor behind surging home prices: job creation exceeding housing construction.
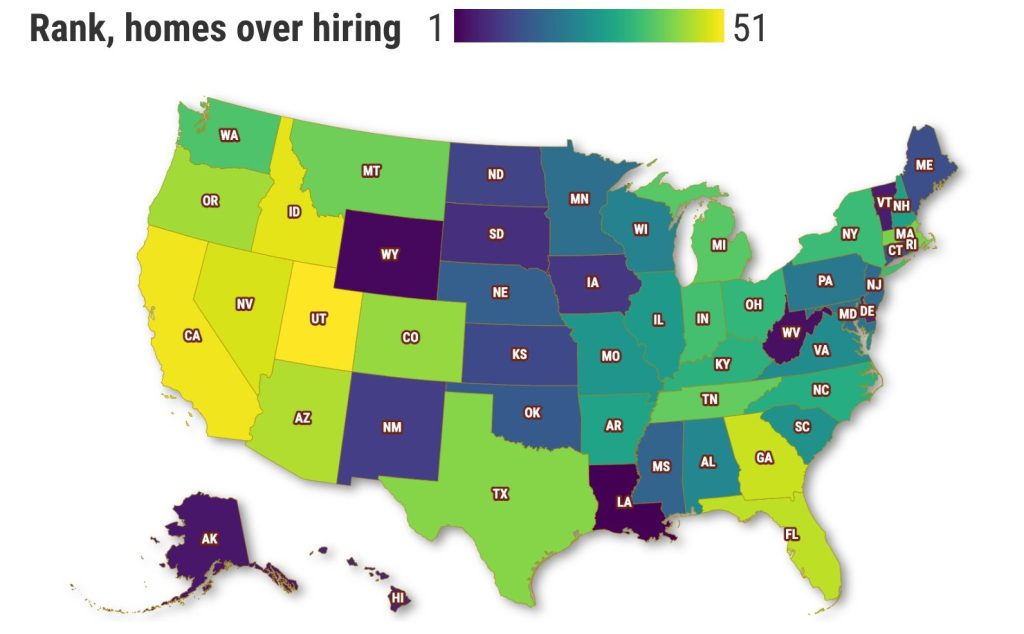
Ponder what I call a “homebuilding hole” benchmark, which compares a state’s job growth with the number of housing units permitted — both rental and for purchase — since 2010.
And then, to give a sense of scale to this shortfall, rankings were determined by the hole’s size as a share of the state’s workforce.
Topline
California builders filed permits for 1.1 million housing units from 2010 through 2022’s first quarter, according to U.S. Census Bureau stats. This might surprise you: It’s the third-largest homebuilding total nationwide behind Texas and Florida.
In the same period, California bosses added 3.1 million more workers — No. 1 among the states, says the Bureau of Labor Statistics.

That imbalance creates a California “homebuilding hole” of 2 million fewer homes created than workers added. And that hole equals 12.6% of the state’s 15.6 million workers, the No. 2 share in the nation.
This chasm is a critical reason why California home prices are up 102% since 2010, the eighth-largest increase among the states, according to a Federal Housing Finance Agency index.
Details
More hiring than building is by no means a California oddity.
Let’s look some of the nation’s largest homebuilding holes, ranked as a share of a state’s total employment. These states have some of the best-performing economies in the nation and also have solid reputations for their homebuilding prowess.
No. 1 Utah: 267,203 permits filed since 2010 (No. 15 nationally) trailing 478,600 more jobs (No. 12). That’s a 211,397 hole or 15.1% of jobs. Prices? Up 119% since 2010, No. 3.
No. 3 Idaho: 139,804 permits (No. 30 nationally) trailing 215,400 more jobs (No. 25). That’s a 75,596 hole or 11% of jobs. Prices? Up 130% since 2010, tops in the nation.
No. 4 Nevada: 180,864 permits (No. 26 nationally) trailing 317,800 more jobs (No. 20). That’s a 136,936 hole or 10.8% of jobs. Prices? Up 129% since 2010, No. 2.
No. 5 Georgia: 518,301 permits (No. 5 nationally) trailing 899,700 more jobs (No. 4). That’s a 381,399 hole or 8.9% of jobs. Prices? Up 71% since 2010, No. 16.
No. 6 Florida: 1.37 million permits (No. 2 nationally) trailing 2.08 million more jobs (No. 3). That’s a 708,167 hole or 8.7% of jobs. Prices? Up 110% since 2010, No. 6.
And we can’t ignore Texas, ranking No. 10 on this scorecard with 2.05 million permits (No. 1 nationally) trailing 2.89 million more jobs (No. 2). That’s an 832,319 hole or 7.1% of jobs. Prices? Up 97% since 2010, No. 9.

Bottom line
All told, 32 states including California and the District of Columbia had more hiring than homebuilding after the Great Recession ended.
These states permitted 12 million residences since 2010 as 19.2 million workers were added — a collective 7.2 million homebuilding hole. The rest of the nation had 500,000 more construction permits than new employees.
So, it makes sense that these 32 states averaged 74% home-price appreciation since the Great Recession vs. 49% elsewhere across the country.
Postscript
Here are the 19 states where homebuilding outpaced job creation — and note the modest home-price growth since 2010: Connecticut (24%), Delaware (33%), Mississippi (36%), New Jersey (36%), Alaska (36%), West Virginia (37%), Louisiana (37%), New Mexico (42%), Vermont (43%), Iowa (47%), Wyoming (50%), Oklahoma (52%), Kansas (54%), Minnesota (58%), Maine (62%), North Dakota (67%), Nebraska (68%), Hawaii (69%), and South Dakota (73%).
Jonathan Lansner is the business columnist for the Southern California News Group. He can be reached at jlansner@scng.com


