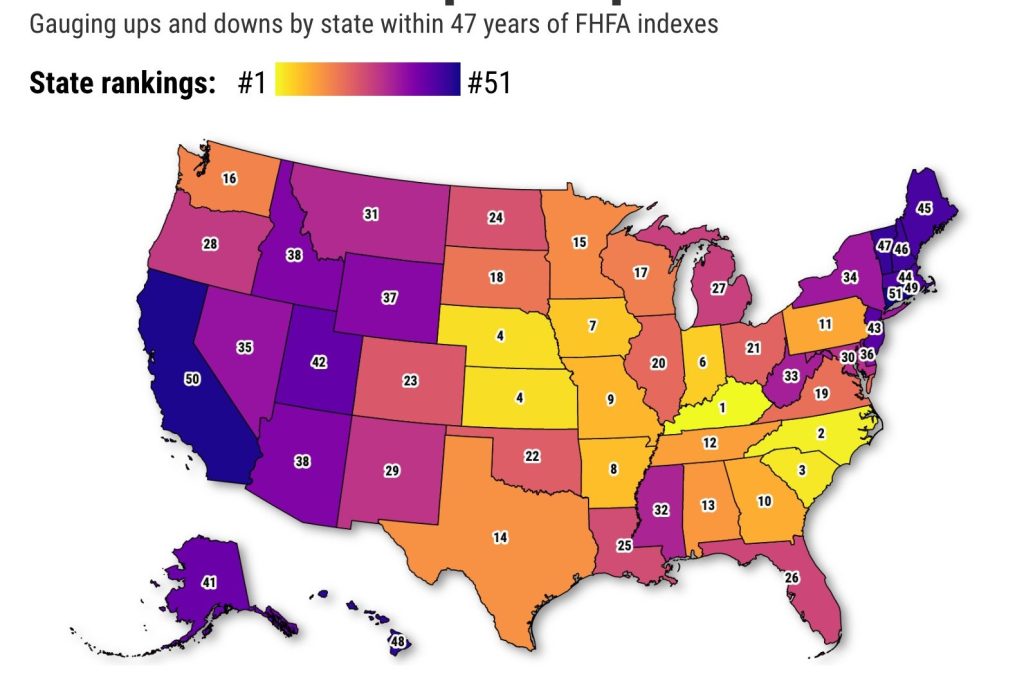
“Bubble Watch” digs into trends that may indicate economic and/or housing market troubles ahead.
Buzz: California is the second-least predictable housing market in the nation.
Source: My trusty spreadsheet created a home-price consistency scorecard using Federal Housing Finance Agency’s quarterly indexes tracking state performances over 47 years. This math looked at 12-month price changes since 1975 — the share of losing periods, volatility in price changes and state rankings, and average gains.
The trend
Only Connecticut ranked less predictable than California over the past 47 years. Then came Rhode Island, Hawaii and Vermont.
Most predictable? Kentucky, then North Carolina, South Carolina, Kansas and Nebraska.
As for California’s arch-rivals: Texas was 14th most predictable and Florida was No. 26.
The dissection
How hot has the market been?
No state has had a year-over-year price decline in 24 quarters. This six years of upswings tops the 23-quarter steak from the bubble era of the mid-2000s.
Remember, prices have fallen on average 17% of the time since 1975. And California ranks fourth-worst for such declines, with dips in 25% of its 12-month performances since 1975.
Also, my spreadsheet found California had the wildest swings in its national ranking among the states. And it ranked fourth-worst for price volatility.
The good news for Californians is that homeowners were well-compensated for the rollercoaster ride with an average 7.1% annual price appreciation over 47 years — second-best among the states.
How bubbly?
On a scale of zero bubbles (no bubble here) to five bubbles (five-alarm warning) … FIVE BUBBLES!
Need I say more than California’s 21.3% gain in the year ended in June was the 13th biggest increase in 47 years?
And you can expand the anxieties nationally, as that outsized jump ranked only No. 17 among the states.
The top gainer was Florida at 30%, then Arizona at 29%, and Tennessee at 27%. The smallest gains were DC’s 11%, followed by North Dakota at 13% and Louisiana at 13.5%.
Politically speaking
Since it’s a midterm election year, we will take partisan slices of the rankings — defining “blue” states as those who supported President Biden vs. “red” those who did not as “red” states.
The spreadsheet found red states have more predictable home values (an average No. 19 rank vs. No. 33 in blue states); had better returns in the past year (20.3% average gains vs. 19.5%); but had smaller long-term prices increases (4.5% a year since 1975 vs. 5.5%).
Jonathan Lansner is business columnist for the Southern California News Group. He can be reached at jlansner@scng.com


