
“Bubble Watch” digs into trends that may indicate economic and/or housing market troubles ahead.
Buzz: California homebuyers signed far fewer deals in April while owners listed slightly cheaper homes as the novel coronavirus continued to throttle the state’s economy.
Source: My trusty spreadsheet looked at April stats from brokers’ listing services compiled by Realtor.com through a partnership with the Federal Reserve Bank of St. Louis.
The Trend
Buyers balked with a steep drop to 33,572 pending sales — down 26% from March and down 18% in a year. Still, it’s not far from typical as homes in escrow have averaged 35,969 since July 2016. The big question: How many pending sales will actually close due to stiffer loan qualification standards and financial troubles at some mortgage companies?
Sellers have been quicker to return to the market. Active listings rebounded to 62,150 single-family homes, condos and townhomes for sale — up 4.4% from March but down 21% in a year. This is a limited inventory as supply has averaged 76,146 since July 2016.
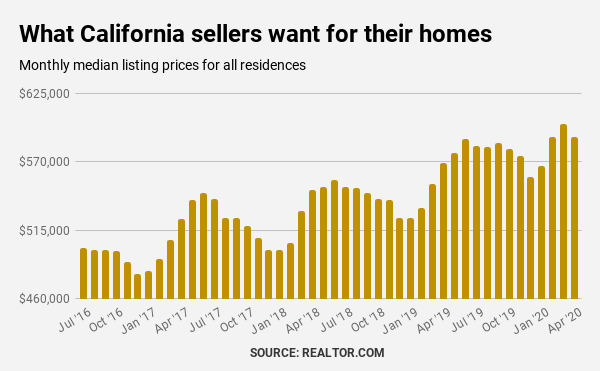
Those sellers apparently are feeling some pricing pressures. The $590,000 median list price is down 1.7% in a month but up 3.7% in a year. In the previous 12 months, sellers were raising asking prices at a 6.8% annual clip.
The Dissection
The state’s housing market has been rocked by the business limitations required to stem the spread of COVID-19. More than 4 million Californians have applied for unemployment insurance since stay-at-home orders became the norm.
This is a slower market with a typical home’s “days on market” growing to 51 — up 7 days in a month and up 8.5 days in a year. Again, not too far from the norm. Selling speed has averaged 49 days since July 2016.
Sellers are, at a minimum, less aggressive on the price. April’s $321 median price per square foot is down 1.7% from March and only up 3.4% in a year. In the previous 12 months, house hunters watched this cost index rise at a 5.6% a year pace.
And let’s note that what’s for sale hasn’t changed much. The median listing is 1,845 square feet — down just 22 feet vs. the previous 12 months’ average.
How bubbly?
On a scale of zero bubbles (no bubble here) to five bubbles (five-alarm warning) … THREE BUBBLES!
The steep sales drop is unnerving. But is it just a delay of transactions due to the virus? Or is it a true market slowdown?
Pricing is a key variable. It’s obvious the sellers didn’t want to discount much in April.
The number of listings with price cuts was down to 10,540 — off 16% in a month and down 53% in a year. These cuts were only 17% of inventory — that’s below the 21% of March and 28.5% in April 2019. Since 2016, cuts have averaged 25.2% of supply.
Are folks pulling homes off the market rather than cutting prices? Only time will tell.


