Airbnb filed to go public today, bringing the well-known unicorn one step closer to being a public company.
The financial results show a company on the rebound, but smaller than it was. Its more granular financial results also make clear how hard the pandemic was on the travel-reliant unicorn. Regarding Airbnb’s worth, investors will have to balance how they value recovery and recent profits over the company’s disrupted historical growth arc.
How did we get here?
The home-sharing startup had a tumultuous year, with the COVID-19 pandemic harming its business in the first and second quarters of the year, and Airbnb later recovering on the strength of more local bookings.
Its filing comes mere days after fellow unicorns DoorDash and C3.ai themselves filed to go public in what could be a rush to the public markets by richly valued startups.
Airbnb’s S-1 filing was expected to come last week, but was delayed due to purported election concerns, a concept that TechCrunch staff did not find entirely convincing.
We’ve scraped together quite a lot about Airbnb’s recent financial performance, but its S-1 is the real treasure trove. What follows is a dive into the company’s high-level numbers. From there, TechCrunch will dig into the company’s financial nuances and ownership stakes.
Airbnb’s financial performance
What we want to know is how the pandemic impacted Airbnb’s business; its year-to-date results, and what we can suss out from its quarterly trends.
Up top in Airbnb’s S-1 is a chart that shows monthly bookings on its platform. The implication is somewhat simple; namely that Airbnb knows what we want to know and wanted to share. Here are those numbers:

As expected, Airbnb took a huge hit in March. But by May things were back to year-over-year growth, where they stayed.
Now, the company has seen precious little bookings growth since June — indeed it has seen bookings fall in the months since. And, worse, the company’s gross bookings after removing cancellations are down on a year-over-year basis. (Update: We misread this table at first, and have updated our notes on it.)
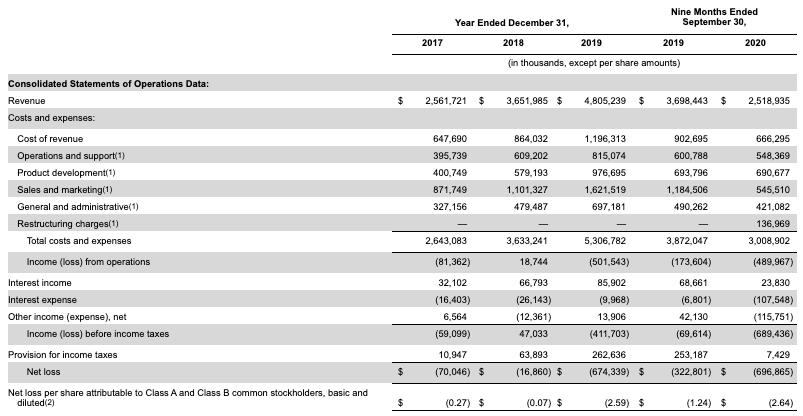
So, what does all of that look like in more traditional accounting figures? Here’s Airbnb’s reported income statement:

As expected, Airbnb’s year has not been tremendous. Indeed, the company is on track to match its 2018 size, if we have our math correct.
What changed from the first three quarters of 2019 to the first three quarters of 2020? The biggest thing, apart from expected lowers revenue costs — less revenue costs less — is the huge decline in sales and marketing spend at the company. Airbnb slashed S&M outlays from $1.18 billion in the first three quarters of 2019 to just $545.5 million in the same period of 2020.
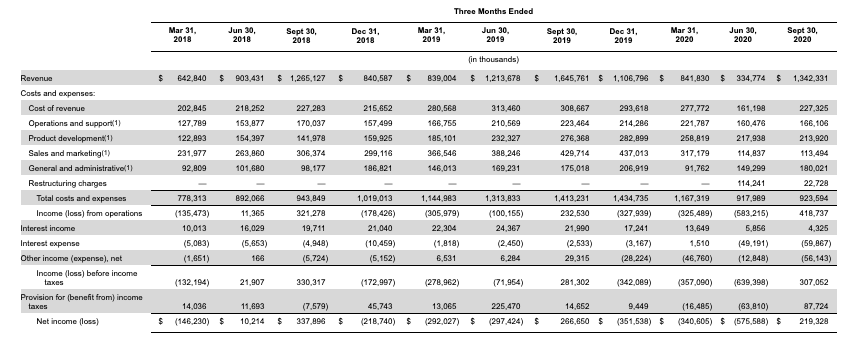
So, where will Airbnb wind up in 2020 once it’s all done? We’ll need to peek at its quarterly results for that. Here they are:

Airbnb’s growth continues in year-over-year terms right until the March 31, 2020 quarter, when it was effectively flat compared to Q1 2019. Or, the company would have grown sans COVID-19. In the June 30, 2020 quarter we see the real damage, with Airbnb’s revenue falling from $1.2 billion in the year-ago quarter to just $334.8 million. That’s a shocking decline.
But, looking ahead to Q3 2020 and we see a large return to form. Yes, Airbnb’s third quarter was smaller than its Q3 2019, with $1.34 billion in top line instead of $1.65 billion in 2019, but the company effectively quadrupled from its preceding quarter. If the company manages another Q3 worth of revenue in Q4, it would be larger than it was in 2018 by a few hundred million.
Critically, Airbnb managed to swing from a number of unprofitable quarters to a profit in Q3, akin to its 2019 Q3 when it was also in the black. Of course, Airbnb’s $219.3 million in GAAP net income during the third quarter pales compared to its losses tallied earlier in the year. The company will not break even in 2020.
Airbnb also reported adjusted profit metrics. Its adjusted EBITDA results are based on the following definition:
Adjusted EBITDA is defined as net income or loss adjusted for (i) provision for income taxes; (ii) interest income, interest expense, and other income (expense), net; (iii) depreciation and amortization; (iv) stock-based compensation expense; (v) net changes to the reserves for lodging taxes for which we may be held jointly liable with hosts for collecting and remitting such taxes; and (vi) restructuring charges.
The decision to remove restructuring costs raised eyebrows, with Amy Cheetham, an investor at Costanoa Ventures saying that “it feels like leaving out restructuring costs is a little aggressive?” We agree, as it gives the company too much flexibility to count the good in its results, like lower operating costs, while discounting what it took to get those results, like restructuring its business operations.
That’s having your cake and eating it as well and not counting the calories.
Still, who are we to withhold numbers from you? Here is the very adjusted EBITDA that Airbnb claims:

The numbers are still not good even after ripping out so very any costs. Worse, perhaps is the company’s cash burn in the year. That deficit helps explain why Airbnb took on more capital when it did earlier this year.
It’s hard to put a firm grade on this S-1. It contains what we expected, but how investors weigh the company’s year-over-year revenue declines in Q3 2020 against its rapid comeback from Q2 2020 should help decide its eventual value. On the whole Airbnb has managed something incredibly impressive — bouncing back from so low a low.
But, now that it’s going public we can’t merely say good job; it wants to price itself well and trade strongly. So, all eyes on its first IPO range as that should tell us what investors just might be willing to pay for the famous company’s equity.


